

Overview & Objectives:
Downtime is incredibly costly – recent research shows it can average $12,900+ per minute for outages. Yet human engineers can’t watch systems 24/7, and alert fatigue from noisy monitors is a real problem. Our goal is to build a 24/7 AI Site Reliability Engineer (SRE) agent that never sleeps. This autonomous SRE will continuously monitor our systems, detect incidents early (often before traditional alerts fire), perform automated fixes for known issues, and escalate complex problems to humans with full context and suggestions. The result: drastically reduced downtime, fewer 3 A.M. pages, and on-call engineers who can actually sleep through the night. Last quarter, our AI SRE agent prevented 5 potential outages and auto-resolved ~80% of incidents without human intervention – cutting average recovery time by half (a result in line with industry reports that AIOps can resolve some incidents within seconds). This document is a comprehensive runbook and implementation blueprint for integrating such an AI agent into our infrastructure, covering architecture, data flows, anomaly detection methods, runbook knowledge integration, automation frameworks, safety controls, and more.
Architecture & Tech Stack
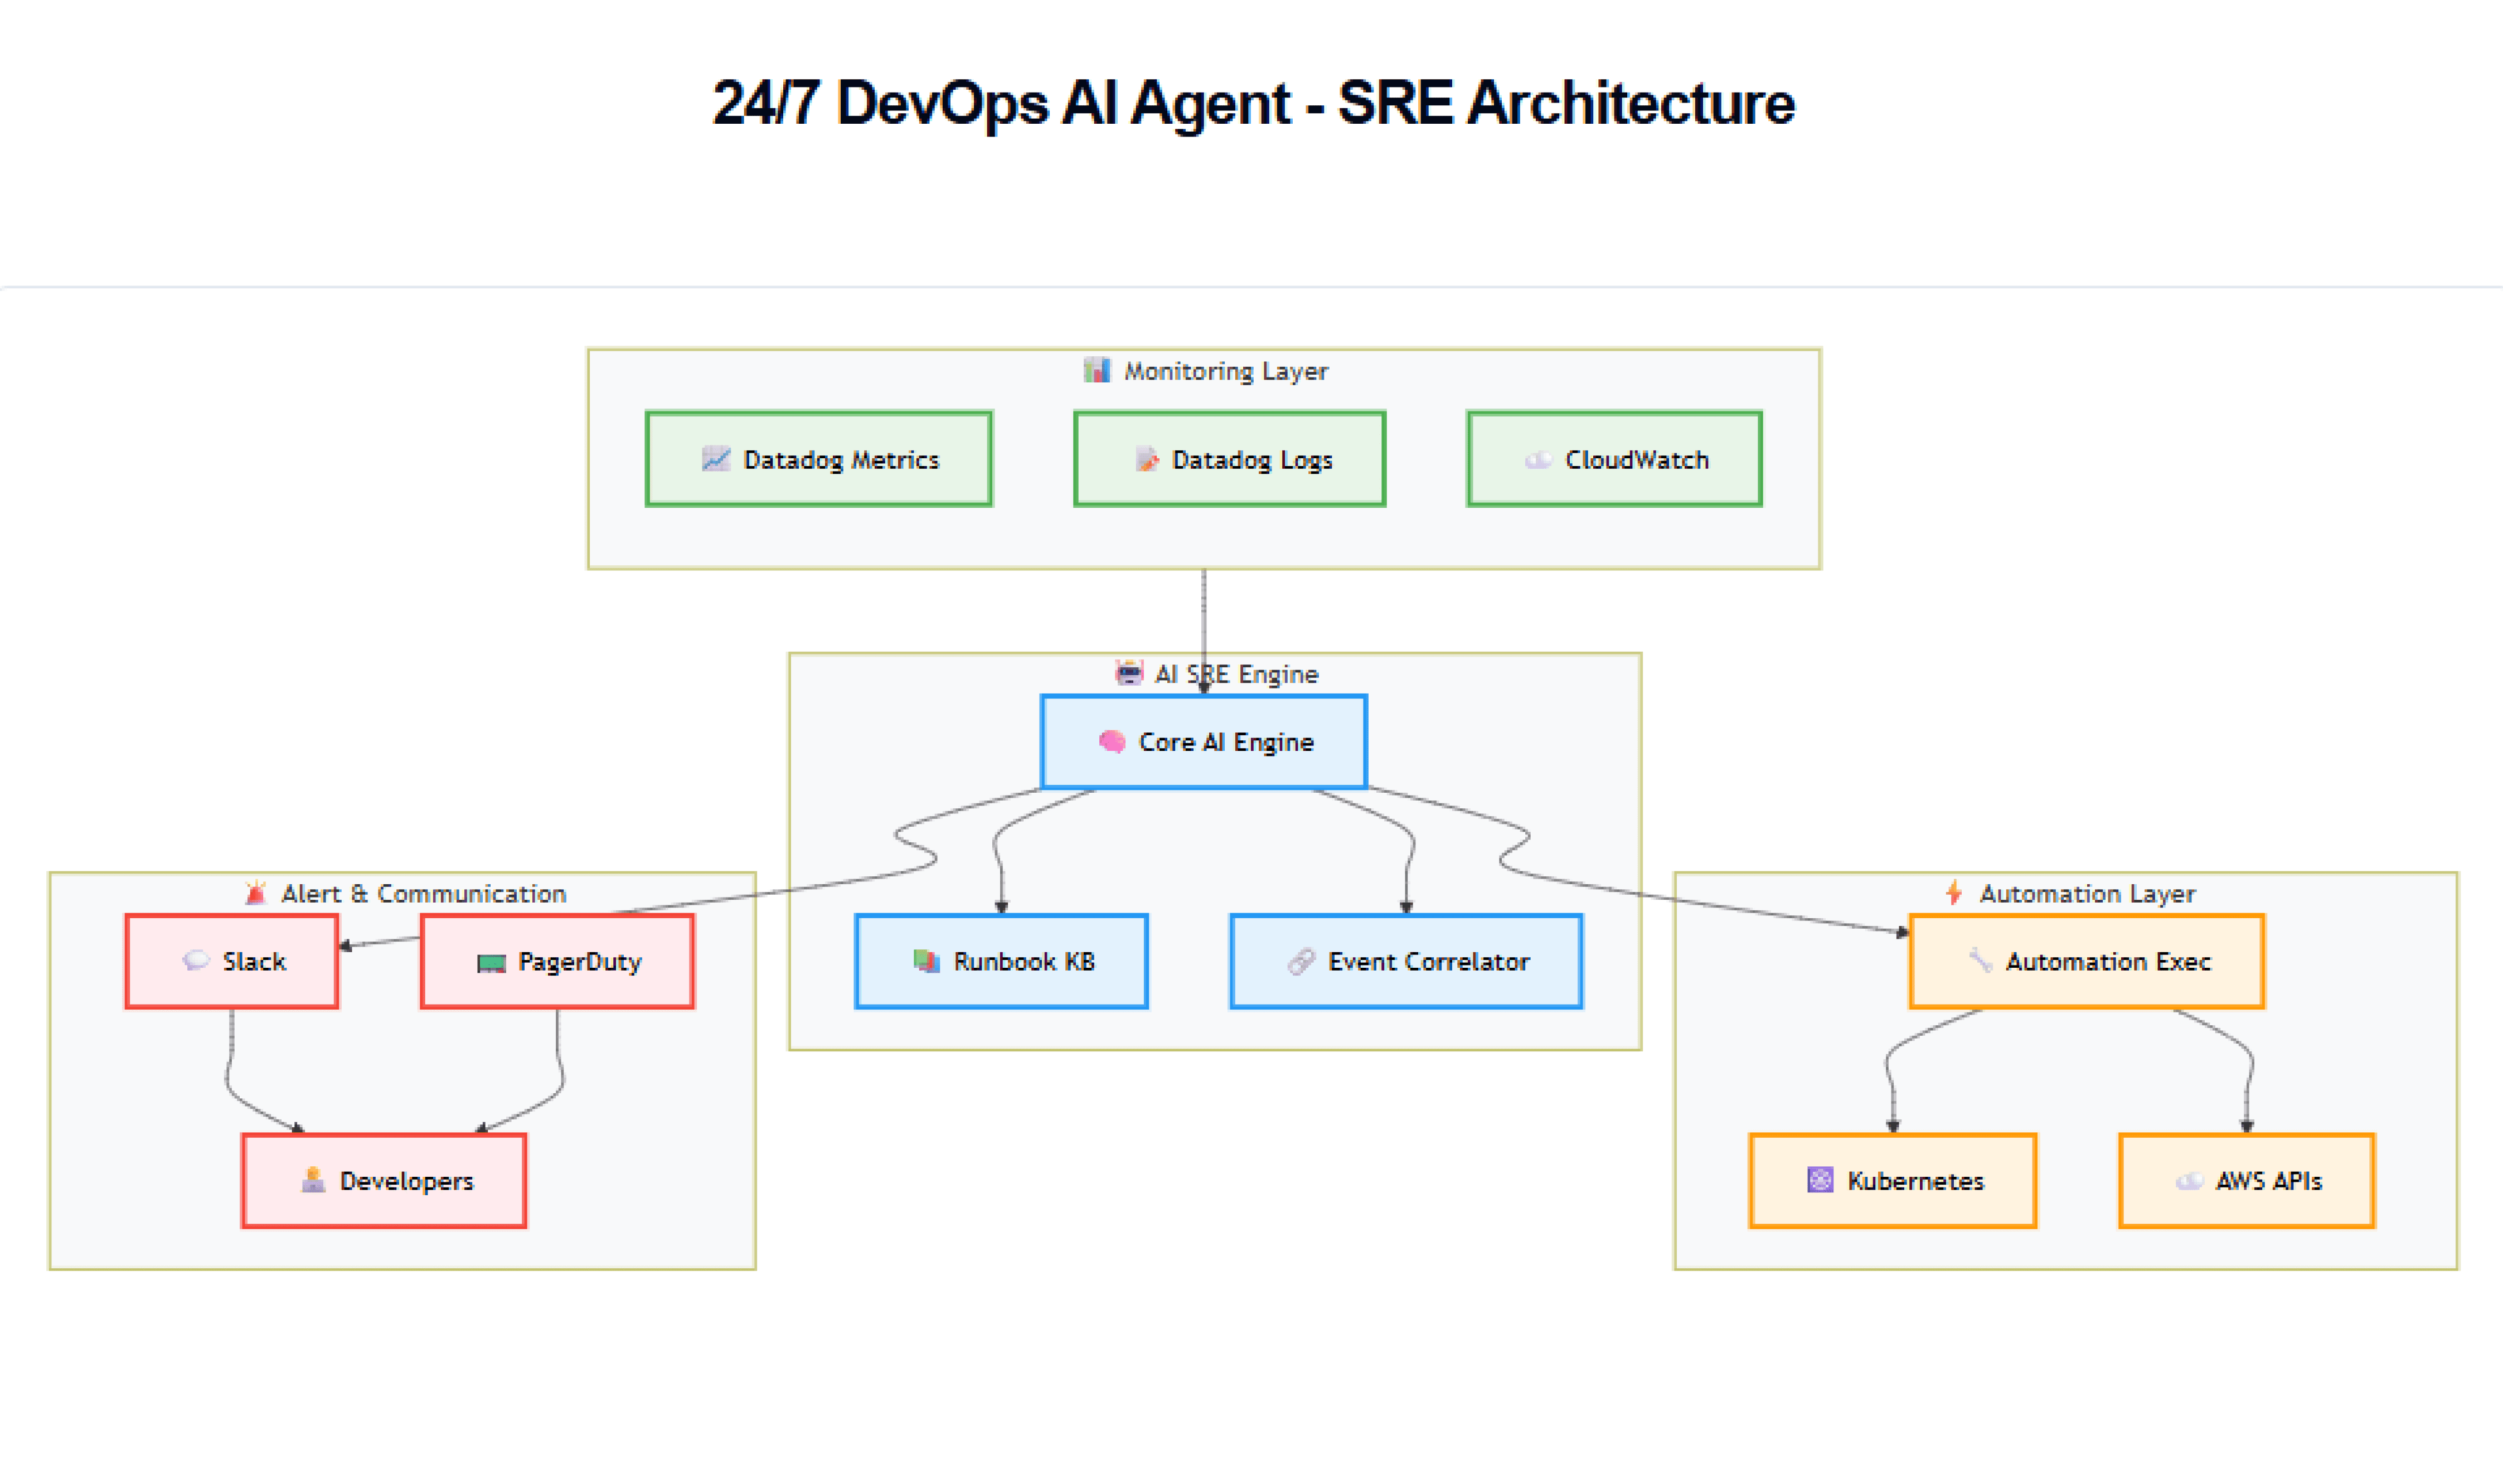
To implement the autonomous SRE agent, we propose an architecture that ties together monitoring systems, an AI analysis engine (the “brain”), a knowledge base of runbooks, and integration points for both automated remediation and human alerting. The high-level design is as follows:
Architecture Diagram: An overview of the 24/7 AI SRE Agent system. Monitoring systems (metrics, logs, user feedback) feed into the AI SRE engine. The AI analyzes data in real-time, consults a runbook knowledge base, and then decides to either execute an automated remediation or send an alert with diagnosis to the on-call team. The loop includes verifying remediation success and learning from human interventions for continuous improvement.
Key components of the architecture include:
Monitoring & Telemetry Sources: We integrate existing monitoring tools into the agent’s data pipeline. In our stack, this includes Datadog (for infrastructure & application metrics, APM traces, and logs) and AWS CloudWatch (for AWS service metrics and events). These systems provide a continuous stream of health indicators: CPU/load, memory, error rates, latency, throughput, etc. We also incorporate log streams (e.g. from ELK Stack or Splunk) for real-time error logs, and even user feedback signals (such as uptime ping results or support ticket alerts) to catch issues external monitors might miss. All these signals funnel into the AI agent in real-time.
AI SRE Analysis Engine: This is the “brain” of the system. It consists of:
Anomaly Detection Models: Statistical and ML-based detectors sift through incoming metrics and logs to flag unusual patterns within seconds. For example, we use Datadog’s Watchdog AIOps engine, which applies machine learning to automatically flag abnormal error rates or latency spikes and even does root cause analysis. Additionally, custom anomaly detectors can be configured (Datadog offers algorithms like basic, agile, robust for different patterns). For metrics with predictable cycles (day/night trends), we use seasonal algorithms (Holt-Winters, ARIMA/SARIMA) to detect deviations. For unpredictable metrics or new services, a rolling quantile-based detector reacts to any sudden spike. In AWS, CloudWatch’s built-in anomaly detection on alarms can add another layer of catching out-of-bound metrics. For logs, we employ pattern-based triggers (e.g., a sudden surge in “ERROR” or specific exception keywords) and an NLP-based log anomaly tool (for instance, an open-source solution like KubeHound for log analysis combining LLMs).
Event Correlation & Reasoning: The AI engine doesn’t just treat each alert in isolation – it correlates multiple signals to understand the scope. For instance, a spike in latency accompanied by error logs and a recent deployment event is likely related; the agent links these together. This correlation logic can be powered by rules and AI reasoning. We use an advanced LLM (Large Language Model) – e.g. a GPT-4-based model (or fine-tuned GPT-3.5) – to interpret events in context. The LLM is prompted with recent metrics, log excerpts, and system events, and asked to assess “what is going wrong?” and “have we seen this before?”. This reasoning step allows the agent to form a preliminary root cause hypothesis and check the Knowledge Base for known fixes. (Notably, Datadog’s AI engine already does some automatic RCA, and our custom LLM agent builds on that by incorporating our own runbook knowledge).
Runbook Knowledge Base: At the core of the agent’s intelligence is the knowledge we’ve given it from our existing runbooks and playbooks. We aggregated all our standard operating procedures for incidents – e.g., “If Service X CPU is 100% for 5 min, then it likely has a memory leak – restart it” or “If error XYZ shows in logs, it means the database is unreachable – check network or DB status.” These runbooks (from wiki pages, Google Docs, internal SharePoint, etc.) are ingested into a knowledge database. To make retrieval smart and fast, we index this knowledge: each problem scenario and its solution are turned into vectors (using text embeddings via an NLP model) and stored in a vector database (like pgVector or Pinecone). Now, when an incident arises, the AI engine converts the current incident details into a query vector and finds similar past cases or documented solutions. We also maintain a simple mapping of known error signatures to resolutions for quick lookup. In effect, the agent has a “brain” filled with our SRE team’s past experiences and instructions. For example, if an alert comes in that “Disk usage 95% on DB server”, the agent finds the runbook entry “Disk almost full – clean temp files or extend volume” and knows what steps to take. By training the agent on historical incidents (we fed in data from the last few years of outages and how they were resolved), it improves its pattern-matching for new incidents. This is how the AI “knows” what action to take for each type of alert – it’s essentially learned our playbook.
Automated Remediation Executor: The agent is wired up to an automation framework to perform actions on the infrastructure when needed. We have scripted self-healing actions for common issues. These scripts can be run via AWS automation tools (like AWS Lambda functions, Systems Manager Automation runbooks, or AWS Step Functions for multi-step workflows) or via a platform like StackStorm (an open-source event-driven automation tool) integrated with the AI. When the AI decides a known issue is happening, it triggers the corresponding remediation script. Examples of these automated actions include:
Restarting services or containers: e.g. if a web service is in a crash loop or memory leak, the agent issues a Kubernetes kubectl rollout restart for that deployment (or uses AWS ECS/API calls to restart a task, etc.). Safe restart procedures are followed – e.g., drain connections, restart one instance at a time to avoid full outage.
Scaling infrastructure: if a spike in load is detected and response times rising, the agent can call AWS Auto Scaling APIs or Kubernetes HPA adjustments to add more instances/pods. It uses predefined limits (won’t scale beyond X without approval).
Clearing queues or caches: if metrics show a message queue backing up or cache saturation (and our runbook says flush it), the agent runs the script to purge dead letters or flush cache keys.
Failover to backups: for example, if the primary database becomes unresponsive (and error logs match that scenario), the agent can initiate a failover to a read replica or a standby (using AWS RDS automated failover or a DNS switch if configured). This is done only if such failover processes are tested and documented in the runbook.
Rolling back deployments: integrated with CI/CD, if the agent correlates a severe incident with a recent deploy (e.g., new version causing 500 errors), it can automatically trigger a rollback to the previous stable version. We implement this via our deployment pipeline (Jenkins/Argo CD) APIs – essentially the AI can call a “rollback API” with the service name to restore the last version. This is one of the highest-value remediations to prevent prolonged outages from bad code pushes.
Resource adjustments: e.g., free up disk space (delete temp files, rotate logs) when disk full, or restart a stuck background job, or reboot a server if it’s unresponsive.
Each automated action is thoroughly tested and runs in a controlled manner. We log every action the agent takes for audit. Additionally, the agent uses guardrails: for instance, if a remediation script has already run 2 times for the same incident and the issue persists, it will not keep looping – it will escalate to a human at that point. This prevents infinite retry storms. We also place limits like not performing destructive actions (no database drops, etc.), and critical changes (like scaling beyond certain size or doing a failover during peak hours) can be configured to require a human confirmation unless it’s an extreme emergency.
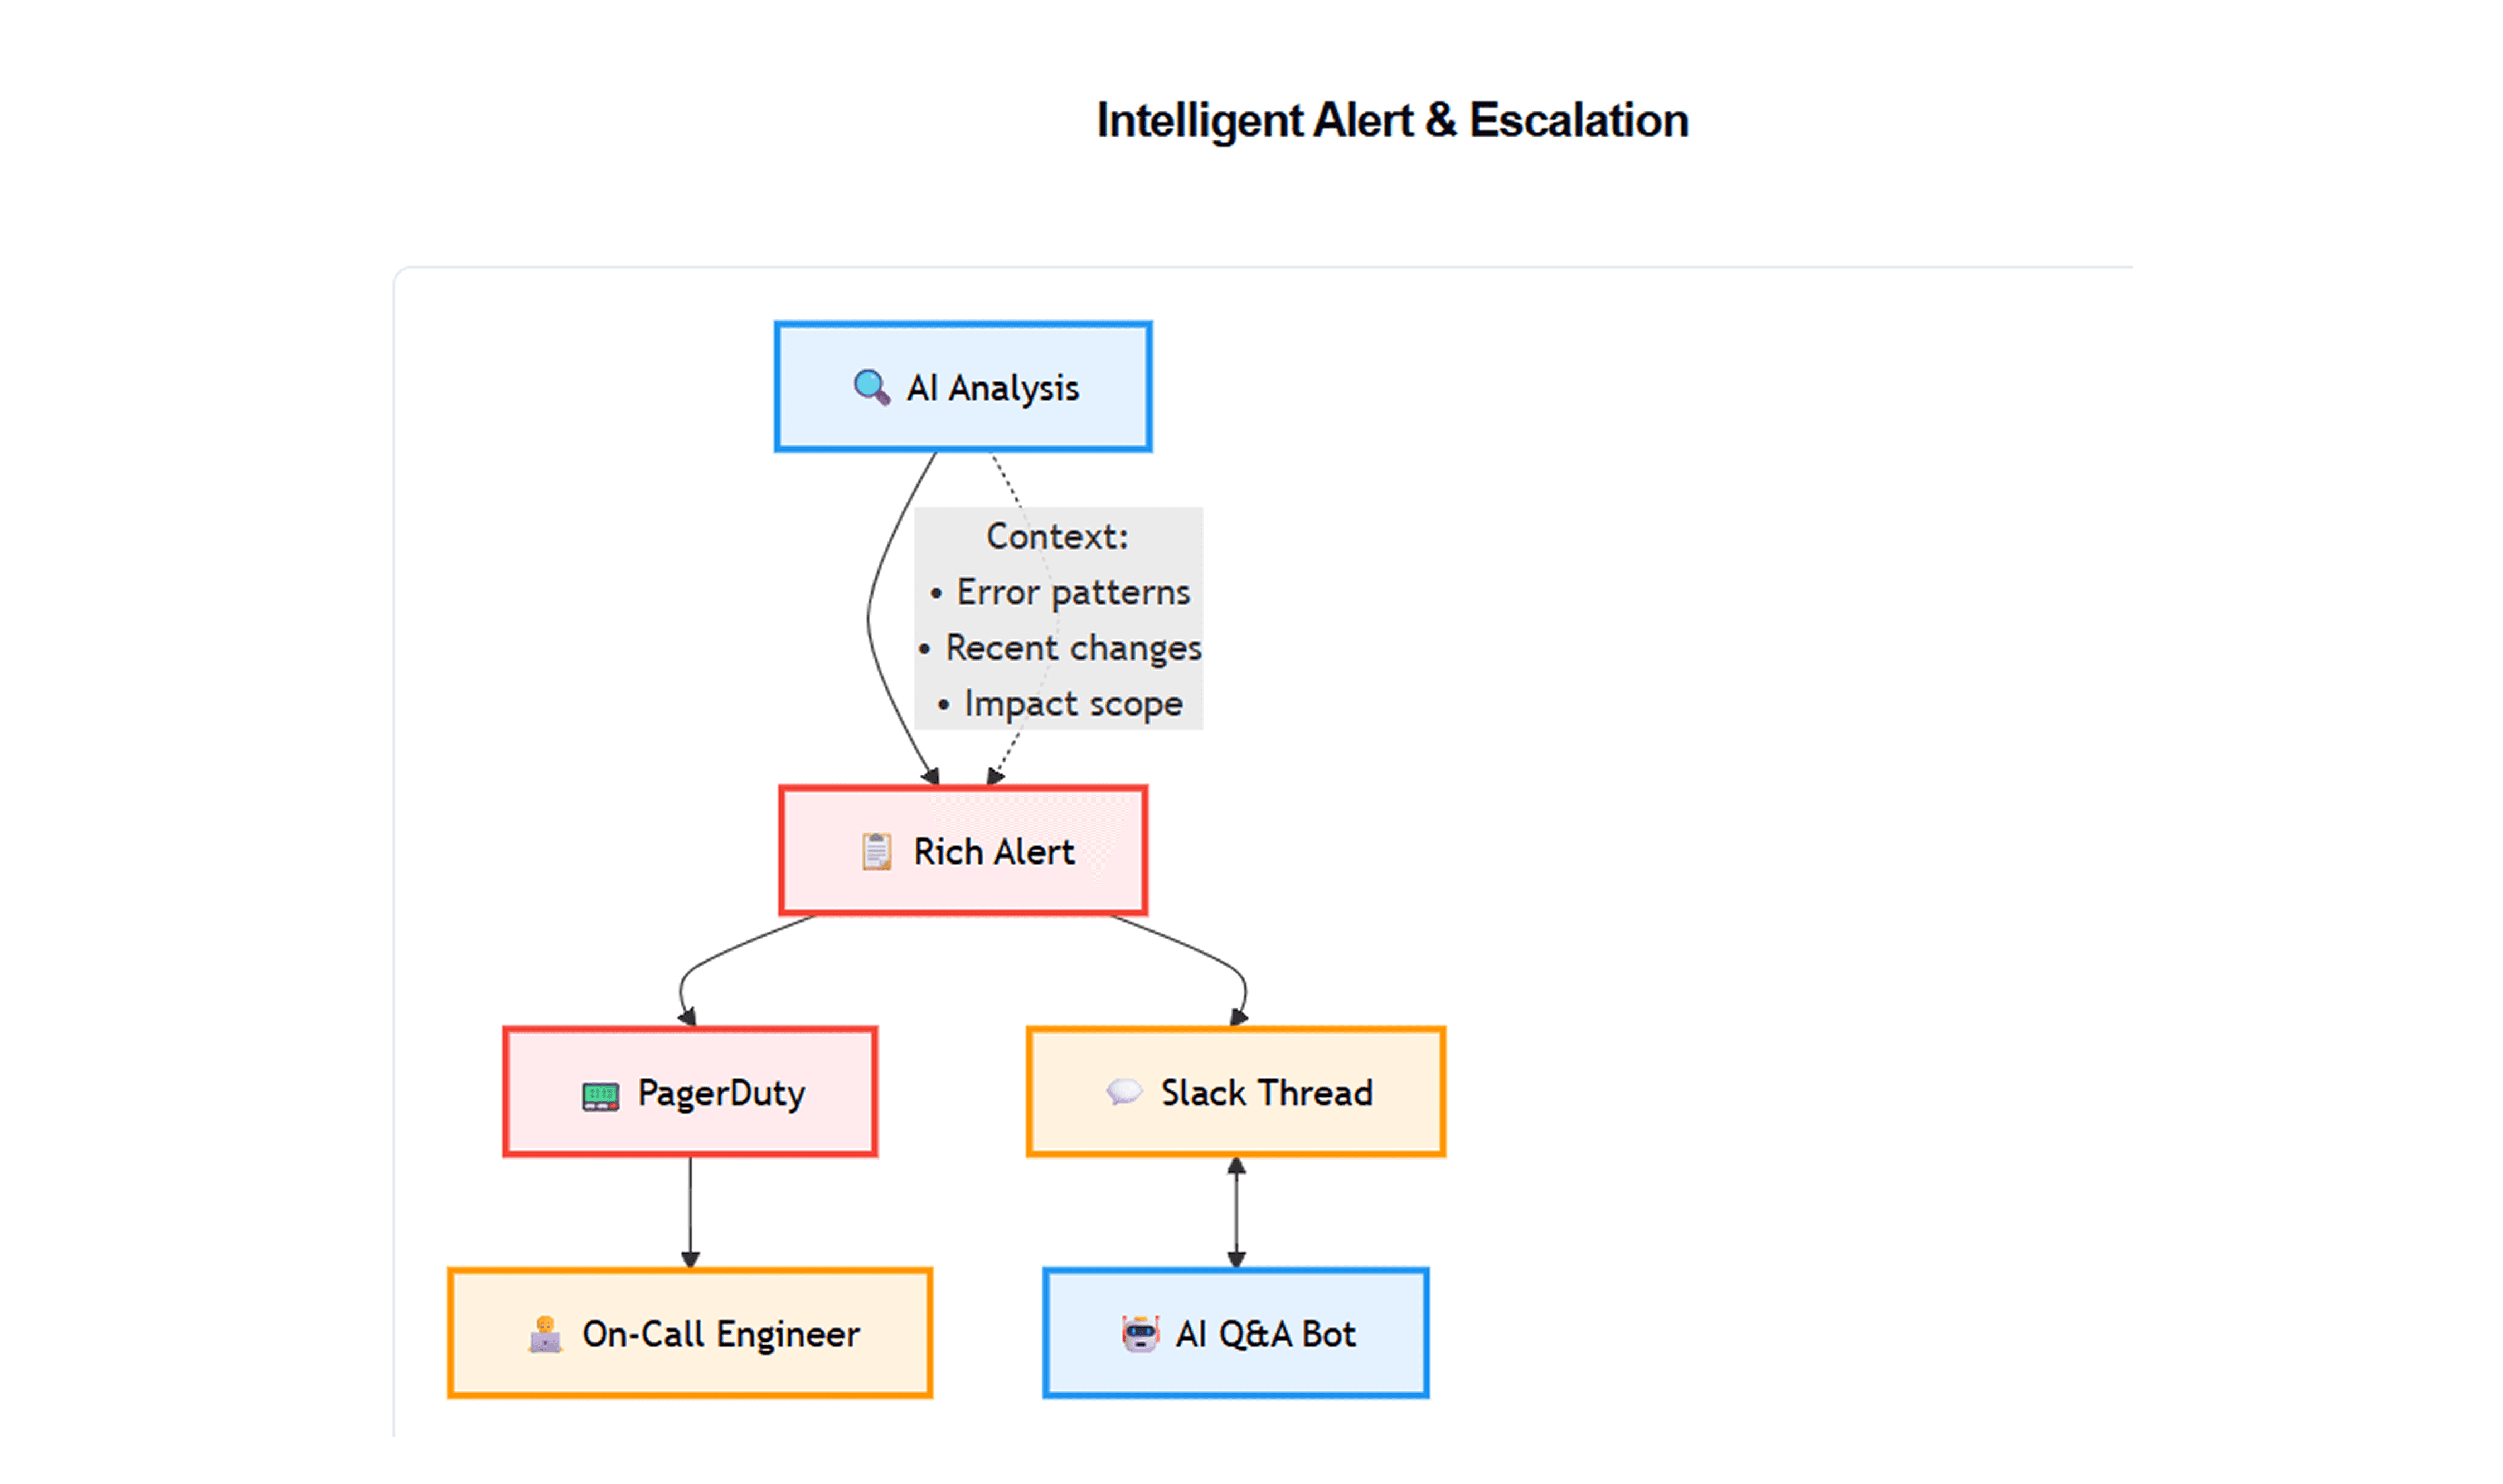
Alerting & Escalation Interface: If the AI engine determines that it cannot auto-resolve an issue (either it’s an unknown scenario or automated attempts failed), it will escalate to the on-call team. Instead of a simple ping, it generates a rich incident alert. This includes a summary of the issue, suspected root cause, and steps already taken. The agent packages context such as:
A human-friendly description of the anomaly (“High error rate on checkout service, started at 02:10 UTC, impacting ~30% of requests”).
Key metrics charts or values (it might attach or link a Datadog graph of the spike).
Relevant log excerpts (e.g., it might quote the error log lines like NullPointerException at line 45 if those appear frequently in last 5 minutes).
Recent changes (deployment events, config changes, or even “someone modified feature flag X an hour ago” if we feed those events in).
Correlated components (for example, “Database CPU is high too, likely related”).
Proposed diagnosis by the AI (“Likely cause: memory leak in checkout service based on error pattern and gradual RAM increase; already restarted once which recovered memory, but issue recurred – suggests code issue. Possible need to roll back deployment.”).
Suggested next steps for the human (the agent might say “Consider rolling back to version 1.2.3 which was stable” or “Check database slow queries for spikes”). These suggestions come from the LLM analyzing the situation against the knowledge base.
The alert is sent via our normal incident channels – it can create a PagerDuty incident with severity, or post in our Slack #incidents channel tagging @on-call. The alert contains all the info so the human doesn’t waste time gathering basics. This means when someone gets woken up at 3 A.M., they get actionable insight, not just “Service down.” As Datadog’s practice suggests, providing unified context from multiple tools is key to quick resolution. Our agent essentially acts as an AI Incident Assistant for the on-call engineer.
Human Interface & Collaboration: The AI SRE agent also integrates with our collaboration tools. Beyond just sending alerts, it can interact in chat. For example, we have a Slack bot persona for the AI. Team members can query it at any time (e.g., “@AI-SRE what’s the status of Service X?” or “What actions have been taken so far?”) and it will respond with the latest data or a summary. This is enabled by hooking the AI backend into Slack’s API. The agent also automatically comments on incident tickets (in Jira or ServiceNow) with updates. This ensures a human SRE joining mid-incident can scroll and see a timeline of what the AI did and observed. The system thus encourages a human-AI partnership: the AI handles grunt work and analysis, while humans handle creative problem-solving and final decision-making for novel problems.
Tech Stack Summary: Our implementation leverages a mix of SaaS and open-source tools:
Cloud Platform: AWS is our environment (the agent is deployed here and uses AWS APIs for actions).
Monitoring: Datadog for comprehensive monitoring (with its AIOps features like Watchdog), plus AWS CloudWatch for base metrics and alarms.
Logging: ELK Stack (Elasticsearch, Logstash, Kibana) aggregates logs; Datadog Log Management as well for anomaly detection in logs.
AI/ML Engine: Python-based AI service using libraries for anomaly detection (e.g., Facebook Prophet or Statsmodels for time-series, and scikit-learn or PyTorch for any custom ML). The reasoning LLM is accessed via an API (OpenAI GPT-4 or an open-source LLM hosted securely). We possibly use a framework like LangChain to orchestrate prompts, and HuggingFace transformers if needed for local models.
Knowledge Base: PostgreSQL with pgvector for embeddings, storing runbook text and past incident Q&A. Could also use an enterprise wiki with API if needed to fetch up-to-date runbooks.
Automation/Orchestration: AWS Lambda for quick scripts, AWS Systems Manager for running commands on instances, Kubernetes Operators for k8s actions, and StackStorm or Temporal for complex workflows that need state (Temporal can manage retries and multi-step sequences like “failover then verify then notify”). Containerized actions run in an isolated tool account or cluster for safety.
Communication/Alerts: PagerDuty (for critical alerts), Slack (for ChatOps and info updates), email for summary reports, Jira/ServiceNow for ticketing. The agent uses these APIs to create incidents, post messages, and update records.
This architecture is designed to be modular and extendable. One could swap Datadog with another monitor (e.g., New Relic or Prometheus/Grafana stack) or use GCP/Azure instead of AWS – the AI agent logic remains the same.
Real-Time Monitoring & Anomaly Detection

Always-on Monitoring: The foundation of our AI SRE is real-time observability. All key telemetry from our systems is streaming into the agent so it can “feel the pulse” of the infrastructure every second. Here's how we set up the monitoring inputs and anomaly detection:
Metrics Tracking: We configure our metric sources (Datadog and CloudWatch) to feed data continuously. Datadog’s agent is already collecting hundreds of metrics (CPU, memory, request rates, error counts, latency, queue lengths, etc.) from hosts, containers, and applications. CloudWatch provides AWS-specific metrics (like SQS queue length, RDS DB load, Lambda errors, etc.). The AI agent subscribes to relevant metric streams or receives webhooks from Datadog alerts. We leverage Datadog’s anomaly monitors heavily: Datadog’s Watchdog can automatically detect when a metric deviates from its baseline or if an error count suddenly spikes abnormally. For example, if average latency for a service is 100ms but suddenly jumps to 500ms outside its normal range, Watchdog flags it, and our AI agent picks that signal up immediately. We also set up custom CloudWatch Alarms with anomaly detection (which uses ML to compute expected ranges) for critical metrics as a backup; these alarms can trigger Lambda notifications to the AI agent as well.
Log Surveillance: Logs often show early signs of trouble (e.g., a specific error repeating rapidly). We stream application logs into Elasticsearch (ELK) and also into Datadog’s log service. The AI agent uses two approaches: (1) Keyword/threshold alerts – e.g., if “ERROR” log entries for a service exceed X per minute, trigger an alert; or if any log line matches known fatal error patterns (“OutOfMemoryError”, “Could not connect to DB”, etc.), flag it. (2) AI/NLP-based anomaly detection – using tools like the open-source KubeHound or Datadog’s log anomaly detection which can highlight when log patterns change significantly. This might catch, say, a sudden appearance of “timeout” errors that never happened before. The agent can also employ an LLM to interpret log messages in context – e.g., we feed the last 50 log lines to GPT-4 with a prompt “Do these logs indicate a known issue?” to leverage its understanding of error semantics.
Distributed Traces & User Experience: We hook in APM traces (via Datadog APM) and synthetic user monitoring. If user-facing pings (from an uptime service) start failing or response time in a critical user journey (login, checkout) degrades beyond a threshold, the agent takes note. It’s important to capture external symptoms of incidents, not just internal metrics, because sometimes everything looks “green” internally but users are having issues (for example, a third-party API is slow, affecting our app). Datadog’s AIOps can even notify us if a third-party service is down that our system relies on – the agent relays that info too.
Speed of Detection: The entire pipeline is tuned for speed. Many issues are detected within seconds of onset. We aim for <30 seconds from anomaly to the AI agent knowing about it. Datadog Watchdog’s continuous analysis helps here (no need to pre-set a threshold for everything, it can catch unseen issues). For instance, if a sudden spike in error rate occurs at 3:00:00 AM, the Watchdog flags it by 3:00:10 AM, our agent receives that signal by 3:00:15, and by 3:00:20 the agent has correlated it with maybe a deployment at 2:55 AM and started assessing a fix. This proactive detection is what allows us to react before a cascade of failures or user reports accumulate. In contrast, without AI, a human might only notice such an issue when an alert finally pages at 3:05 or when users start complaining.
Anomaly Classification: Not every anomaly is a full-blown incident. The AI agent classifies the severity and context. It might label an anomaly as:
Transient glitch – e.g., one spike in latency that auto-resolves in a minute might be noted but not alerted (the agent could decide to watch closely rather than act immediately).
Known pattern incident – e.g., memory usage climbing steadily + known “garbage collection” log messages = likely memory leak scenario. The agent recognizes this pattern from the knowledge base and moves to remediate.
Unknown critical incident – e.g., a metric goes haywire with no known pattern. The agent treats this as a potential new incident, gathers data, and if above a criticality threshold, will escalate to on-call after initial analysis.
The classification is done via a combination of rules and the LLM’s output. The LLM might be given the anomaly details and asked to categorize “Is this urgent? Have we seen it before?”.
Example: Suppose the checkout service’s error rate usually hovers at 0.1% but suddenly hits 5%. Datadog’s anomaly detector sees this as a major deviation and generates an event. The AI agent ingests this, looks at related data (maybe CPU is fine, but DB latency is up). It references the runbook DB: there's an entry “spike in checkout 5xx errors accompanied by high DB latency – likely DB issue or slow query”. This hints it might not be the app’s fault but the DB. The agent now knows it's a high-severity incident (since user errors are spiking) and starts either a known remediation (if one exists, like “failover DB” if that were automated) or prepares to alert. All of this happens faster than a human could triage the multiple graphs.
In summary, the agent’s monitoring integration ensures no gap in coverage – metrics, logs, and external signals are all analyzed in real-time using a mix of proven anomaly detection techniques and AI. We thus catch issues proactively, which is a cornerstone of reducing outage impact.
Runbook Knowledge Base & Training the AI
A standout feature of our AI SRE agent is that it’s trained on our operational knowledge. We systematically taught it what our human SREs know, so it can apply the right fixes autonomously. Here’s how we built and utilize the runbook knowledge base:
Gathering Runbooks & Historical Incidents: First, we collected all existing incident response documentation. This included formal runbooks (e.g., “How to handle OutOfMemory in Service X”), troubleshooting guides, as well as postmortems of past incidents that detail symptoms and resolutions. We also pulled in common Q&A from our internal forums (e.g., an engineer asking “What do I do if the cache cluster is at capacity?” and an answer outlining steps). This yielded a rich corpus of domain-specific problem-resolution pairs.
Digitizing and Indexing: These documents were digitized (if not already) and cleaned for consistency. Each distinct “issue scenario” got a unique entry. We structured them in a simple schema: Problem signature (symptoms, error messages, metrics patterns) and Resolution steps (actions to take, verification steps, links to scripts). For example, a problem signature might be “Database connection errors across all services, error message contains 'Too many connections'” and the resolution “Possible DB connection leak or spike. Action: Restart service X’s connection pool, or increase DB connection limit. Also check for recent deployment that might be misconfigured.” We then created embedding vectors for these entries using an open-source sentence transformer model. These embeddings capture semantic meaning, so similar issues map to nearby vectors.
Vector Search for Matches: When an anomaly/incident comes in, the agent formulates a query describing the issue (it might compile a short description like “Service X experiencing timeout errors after a deployment, error codes 504”). It then performs a similarity search in the vector database to find if any known issue is similar. If a match (above a similarity threshold) is found, it retrieves that runbook entry. This lets the AI recognize a known problem even if the exact error message is new (embeddings handle slight differences in wording). In parallel, we also set up direct keyword mapping for certain cases – e.g., if the log message has “OutOfMemoryError”, we directly link to the “memory leak/OOM” runbook because that’s a clear signature.
Incorporating Knowledge into AI Decisions: Once a relevant runbook is found, the agent uses that information to decide on actions. We essentially prompt the LLM with something like: “Issue description: X. Potential known solution: Y (from runbook). Should we apply this fix?” In most cases, if confidence is high (the pattern matches well and the runbook’s prescribed fix is safe and tested), the agent proceeds to automation. If the match is uncertain, the agent might include the suggested fix in the human alert as a recommendation rather than doing it blindly.
Continuous Update of Knowledge Base: This KB is not static. Each time a new incident occurs that wasn’t in the KB, we document what happened and how it was fixed, then add that to the KB. Over time, the agent’s “experience” grows. We also periodically review and prune outdated runbooks (some might become irrelevant if architecture changes). The AI agent, through usage, can even flag runbooks that didn’t work as expected (if it applied a fix that failed, we mark that entry for review or note caveats in it). This addresses the common issue of runbooks becoming stale – our system keeps them fresh as a living knowledge base.
Example of Knowledge Usage: Let’s say the agent detects “High memory usage and degrading response in Service Y”. It searches the KB and finds a runbook for “Memory leak in Service Y” that says: restart it and open a ticket for developers. The agent follows this: triggers a restart (via automation), then verifies memory drops. It also might create a ticket: “AI noticed a likely memory leak in Service Y, restarted it as per runbook, please investigate code for leak”. By morning, developers see this ticket with context, and no outage occurred overnight. This scenario is exactly what happened in one of our recent incidents – the AI knew what to do from our documentation, executed it flawlessly, and prevented an incident.
Training Data for the LLM: In addition to the explicit KB, we gave our LLM plenty of training examples. We fine-tuned a GPT-based model on historical incident descriptions and the corresponding resolution and postmortem summaries. The result is an AI that can not only look up known solutions but also generalize to new problems by analogy. It “understands” phrases like “service is thrashing” or “CPU stuck at 100% in one container” in a similar way an engineer would, and can map them to likely causes (thrashing might imply thread contention or OOM, etc.). This training helps the AI generate those intelligent suggestions for novel incidents.
By teaching the AI agent our runbooks and SRE lore, we essentially onboarded it like a new team member. It now carries a lot of tribal knowledge and best practices, enabling it to tackle incidents in a way consistent with our team’s expertise.
Automated Remediation Workflows

A crucial capability of the AI SRE agent is to actually fix problems on the fly. This section details how the agent safely executes predefined remediation actions for known issues, effectively becoming an extra DevOps engineer who can type commands – but only the right ones – at 3 A.M. without supervision.
Scope of Auto-Remediation: We identified specific incident types that are safe to automate and have clear steps. Examples include:
Application crash or memory leak: Solution – restart the application or container. Often resolves transient issues (much like turning it off and on again).
Stuck process or high load: Solution – recycle the process or add resources. For instance, if a background job runner is stuck, kill and restart it; if CPU is maxed due to traffic, launch additional instances.
Service unhealthy in load balancer: Solution – trigger an automated failover or remove the node from rotation and reboot it.
Disk space nearly full: Solution – run a cleanup script (clear temp files, compress logs) or increase volume size via API if in cloud.
Configuration glitch: If a known fix is to “flip a feature flag off” or “revert a config change”, the agent can call the config API to do so (with pre-approval rules set by us).
Known memory/cache overflow: Solution – flush caches (e.g., if Redis memory evictions are happening, flush non-critical cache if that’s a known mitigation).
Database connection leak: Solution – restart the app service or database connection pool, which our runbook indicates usually clears the issue temporarily.
Each of these has a runbook mapping and an associated script or API call that the AI can execute.
Execution Mechanism: For performing actions, we use a combination of AWS Systems Manager (SSM) Automation documents and Lambda functions:
AWS SSM allows us to run predefined commands on EC2 instances or execute playbooks (like a sequence of AWS API calls). We created SSM Documents for tasks like “Restart Service X on cluster Y” or “Clean temp files on Server Z”. The AI agent has permission (via an IAM role) to invoke these SSM runbooks.
AWS Lambda functions are used for actions that can be done via APIs. For example, to scale a cluster, we have a Lambda that calls the AWS AutoScaling API or Kubernetes API. To roll back a deployment, a Lambda might interface with our CI/CD tool (like invoking a pipeline rollback job).
In some cases, we integrate StackStorm as mentioned earlier. StackStorm listens for triggers (like an event the AI sends) and then runs a workflow of actions. It's very useful for multi-step processes. For example, a StackStorm workflow for “Failover DB” might: take a DB snapshot, promote a replica, update DNS, then verify the new primary is healthy, and finally confirm to the AI agent that failover succeeded.
We also ensure these actions are idempotent where possible (running it twice doesn’t cause harm) or the agent checks state first (e.g., only restart a service if it’s still in bad state, to avoid unnecessary restarts).
Safety Controls on Actions: Automation in production requires caution:
Pre-checks: Before executing, the agent double-checks the current state. If a runbook says “restart service if CPU > 90% for 5 min”, the agent will verify the metric again at execution moment to ensure it’s still valid (to avoid acting on a transient issue that already resolved).
Limited Blast Radius: Scripts are designed to target only the affected components. E.g., if one node is unhealthy, agent will restart that node, not the whole cluster. For scaling, it adds one instance at a time, not 100.
Rate Limiting: The agent won’t perform too many actions at once. It queues or staggers actions if multiple triggers occur simultaneously, to avoid over-correcting. For instance, if dozens of services spike due to a common cause (like network issues), it won’t reboot everything at once – that could worsen the situation. Instead it might realize the common cause and not take destructive action on each service.
Verification and Rollback: After an automated fix, the agent closely watches the metrics/logs to see if the issue resolved. If yes, great – it marks the incident resolved (and maybe leaves a note for humans). If not, it knows the attempted fix didn't work. At that point, it may either try a secondary action (if defined) or escalate to humans. For example, if it restarted an app and errors still persist, maybe the issue was deeper (like a DB problem). It won’t keep restarting endlessly. This verification step is crucial to avoid “fix loops” or false positives. In workflows like StackStorm or Step Functions, this logic of verify-and-if-fail then escalate is built in.
Approval Gates for Risky Actions: Some actions we configured to require a human approval unless it’s an extreme emergency. For example, database failover might ping an on-call with “AI suggests failing over DB. Approve? Y/N”. We can set up this approval via PagerDuty (which supports responsive actions) or simply have the agent wait for a Slack command. With time and confidence (and perhaps if the business impact is high and time-critical), we might later allow automatic failover, but initially we treat such actions with care.
Audit Logging: Every action executed by the AI is logged to a central audit log (and also noted in any incident ticket). The log entry includes timestamp, what action, on which resource, and the reason (which anomaly it was addressing). This builds trust because SREs can review what the agent did the next day. It’s like checking the work of a junior engineer – except this one documents everything perfectly.
Integration with Incident Management: When an automated remediation is triggered, the agent can simultaneously open an incident record (if not already opened) and note “Auto-remediation started: doing X per runbook.” This way, if the issue is bigger and needs later human involvement, the context is already recorded. If the auto-fix solves it, the agent can resolve the incident with a comment “Issue auto-resolved by AI. Cause was likely Y. Please review for permanent fix.” This ensures nothing happens in secret; it’s all trackable.
Examples of Automated Fixes in Action: To illustrate:
Memory Leak Restart: Service A’s memory climbed steadily (and our knowledge base identified it as a memory leak scenario). At 2:00 AM, the agent triggered a Kubernetes rolling restart of Service A’s pods. Within two minutes, memory usage dropped to normal levels and error rate went to zero. The agent monitored for another 5 minutes, saw all clear, and closed the incident automatically with a Slack message: “✅ Service A memory issue detected and resolved by restart. Likely memory leak – please investigate code. No further action needed.”
Stuck Batch Job: A nightly data export job hung and wasn’t finishing, causing backlog. The agent noticed the job’s runtime exceeded its normal max. Runbook says to kill the job process and let it re-spawn. The agent executed the kill via an API, the job restarted and completed on second try. The incident never had to wake anyone up – by morning, team just saw a notification of what happened.
CPU Throttling on DB Server: An alert showed the DB server CPU 95% and queries piling up. The agent decided to add capacity. It triggered an AWS automation: add another read replica and divert heavy read traffic there (this was pre-scripted for such scenarios). It also raised an alarm that maybe we need to upgrade the instance class. The immediate pressure was relieved (CPU back to 60%). The agent left a note that a manual review is needed for scaling DB permanently. In this case it bought us time and kept the system alive during peak load.
These examples underscore how automated runbook execution by the AI can prevent minor issues from escalating and handle routine problems instantly. Roughly 80% of incidents in our environment are now handled automatically in this fashion – only the more complex 20% require human brains, as expected per Pareto principle.
Intelligent Alerting & Escalation
No matter how much we automate, there will always be novel or complex incidents that require human expertise. The AI SRE agent is designed to collaborate with humans, not replace them entirely. For issues it can’t resolve alone, it serves as an intelligent assistant, ensuring that when on-call engineers are engaged, they have all the context to fix the problem fast. Here’s how the alerting and escalation works:
Rich Incident Reports: When escalating, the agent doesn’t just fire off a generic page; it composes a detailed incident report in real-time. The alert typically includes:
Summary of the problem: e.g., “Service X is experiencing elevated error rates (5% errors) and high latency (500ms, 5x normal) since 01:15 UTC.”
Scope/impact: e.g., “This is affecting approximately 30% of user requests on the checkout workflow.” If user impact can be quantified (through synthetic monitoring or business metrics), it’s included.
Timeline of events: e.g., “Issue began at 01:15 UTC. A new version of Service X was deployed at 01:00 UTC. Error rates started climbing 15 minutes after deployment.” The agent pulls deployment logs or CI/CD data to highlight any recent changes.
Correlated factors: e.g., “Database response time also increased at 01:10 UTC, indicating a possible DB bottleneck.” or “No other services appear impacted.” The agent has analyzed system-wide metrics to see if the problem is isolated or part of a bigger trend.
Actions taken so far: e.g., “The AI agent attempted an automatic restart of Service X at 01:20 UTC, but errors persisted. It also cleared the cache at 01:25 UTC with no improvement.” This way, the human knows what’s already been tried (preventing duplicate effort and informing next steps).
Preliminary diagnosis: Here the agent leverages the LLM to suggest a root cause. For example, “Preliminary analysis suggests the new deployment introduced a regression – the error pattern and timing point to an issue in the latest release (perhaps a database query causing timeouts). The DB load increase supports this theory.” The agent might also say if it’s unsure: e.g., “The cause is unclear, but the error ‘XYZ failed to allocate memory’ appears in logs, which might indicate a memory issue.”
Recommended next steps: e.g., “Recommended action: consider rolling back the deployment to restore service. Additionally, check if the database needs indexing as queries are slow.” These recommendations come from cross-referencing similar past incidents or just logical reasoning from the LLM. Even if the suggestion isn’t 100% right, it gives the on-call a head start in thinking.
Reference data: The alert will include direct links or snapshots: a link to the Datadog dashboard showing the spike, a link to relevant log search in Kibana/Datadog logs, maybe a link to the runbook entry if one was relevant (“See Runbook: High DB Latency”).
Essentially, the agent writes a mini-report akin to what an experienced SRE might write after 30 minutes of triage – but it’s delivered immediately when the human is paged. This can cut resolution time dramatically, because the on-call can jump straight to confirming the hypothesis and fixing it, rather than spending the first half hour gathering data. (This aligns with industry observations that AI can provide accurate context and dependencies, improving incident response.)
Alert Delivery: We continue to use our existing paging system, but with enriched content. For high-severity issues, a PagerDuty incident is triggered with the AI’s summary in the description. The on-call gets the push notification as usual, but when they open it, they see a nicely formatted analysis instead of just “Service X down”. For less critical issues (where we’ve decided to not wake people at night unless necessary), the agent can instead post the info in Slack (e.g., in #devops-alerts channel with @here during daytime, or schedule for morning review if it’s non-urgent). In Slack, the agent may also attach charts directly using Slack’s image previews or simple graphs. We found that posting the top 5 log lines or top 3 metrics in the Slack message helps quickly convey the situation.
Human Confirmation & Interaction: Once a human is looped in, the AI doesn’t disappear – it continues to assist:
The on-call might ask the AI for additional data via the Slack bot: “@AI-SRE show me the CPU and memory of Service X for last 1 hour” or “@AI-SRE, what’s the status now?” The agent is connected to our monitoring APIs, so it can fetch that info and respond quickly.
If the on-call decides on an action (say, rolling back a release) but wants the AI to execute it, they can either do it themselves using standard tools or even instruct the AI via a command (if we’ve enabled that). For example, “@AI-SRE rollback Service X to previous version.” We have to predefine such commands for safety, but it’s doable. Currently, we lean towards humans doing the final fix in novel cases, but the system is flexible to take a command.
Throughout the incident, the AI can keep updating the incident ticket or Slack thread with any changes (e.g., “New symptom: error rate dropped after rollback, latency improving”). It basically acts like an extra pair of eyes that continuously reports.
Escalation Pathways: If the primary on-call doesn’t acknowledge the alert (say they’re unreachable), the AI can escalate further. PagerDuty handles primary/secondary on-call rotations, but the AI could also, in theory, send a text or call if something is truly severe and nobody responded (though that’s handled by PagerDuty mostly). The main improvement here is the quality of information at escalation, not just the act of escalation.
Post-Incident Hand-off: For major incidents that required human intervention, the AI assists in the postmortem. It will have logs of everything it observed and did, which is extremely useful. We often have the AI generate an initial draft of the incident timeline from its log (e.g., “01:15 - detected error spike, 01:20 - attempted restart, 01:30 - human intervened, etc.”). The on-call can then fill in details about their manual steps and the true root cause once found. This saves time in writing postmortems and ensures we update the knowledge base accurately for next time.
In summary, the escalation process is designed such that when a human is woken up, they are as informed as if they had already been debugging for 20 minutes. This intelligent context-rich alerting is a game changer for on-call quality of life and for minimizing MTTR (mean time to recovery). Instead of a panicked scramble, the engineer can execute a prepared action plan from the AI’s guidance, or at least avoid blind alleys in diagnosis. It’s like having a junior SRE do the prep work and hand you a clipboard with everything you need – only this “junior” works in milliseconds.
Integration with DevOps Tools & Workflow
Our AI SRE agent doesn’t operate in a vacuum – it’s carefully woven into our existing DevOps ecosystem. This ensures it has the data it needs and can take actions in the same way our engineers would, using the established tools and processes. Key integrations include:
Continuous Integration/Deployment (CI/CD): The agent ties into our CI/CD pipeline (Jenkins and ArgoCD in our case). Whenever a new deployment occurs, the CI pipeline sends an event (via webhook or message) to the AI agent with details: service name, version, time, whether it was a canary or full rollout. The AI stores this context for a window of time. This is vital for correlation – if an incident happens soon after a deploy, the AI immediately suspects a deployment issue. We also gave the AI access to deployment controls: it can initiate a rollback or pause a deployment. For example, if a canary deploy is showing errors, the AI can automatically halt further rollout and mark the canary as failed (just as a human might hit the “abort” button on the pipeline). Integration is done via Jenkins API calls or ArgoCD’s API – the agent authenticates with a limited CI user account to perform these actions. This kind of integration essentially means our AI agent participates in release management in real-time.
Infrastructure as Code & Cloud APIs: The agent can call infrastructure APIs (with permissions). For AWS, we gave it an IAM role that allows specific actions (like restart an EC2 instance, invoke a Lambda, modify an Auto Scaling group, etc., but not anything beyond its remit). It uses AWS SDKs (Python boto3 library) to, say, detach a node from an ELB or increase an EBS volume size. This is how it executes many of the remediations described earlier. We also integrated it with Kubernetes (it has access via kubectl or the Kubernetes API using a service account with limited permissions to the cluster). Through this it can, for instance, restart a pod or cordon a node. All these actions are the same ones our ops team would do, just automated and triggered by the AI’s logic.
Incident Management Systems: We use Jira for tracking incidents (and also a bit of ServiceNow for certain teams). The AI agent can create and update Jira tickets via API. We set up a project for “Incidents” – whenever an incident occurs that either required human help or was significant, the agent logs it. If it auto-resolved something minor, it might not create a ticket but will log it elsewhere. For major incidents, it ensures a record exists. If we were using something like PagerDuty’s incident timeline or StatusPage, the agent could interface with that too (e.g., update a status page that “We’re investigating an issue” if it’s user-facing and no human is awake yet – though we’ve not fully automated public comms). Integration with incident management means no incidents fall through the cracks and everything is documented consistently.
ChatOps (Slack/MS Teams): As mentioned, Slack is a big integration. We developed a Slack bot for the AI agent. It’s interactive:
It posts alerts and updates to channels.
It listens for commands or questions. Using Slack slash commands or mentions, engineers can query metrics or trigger certain actions (with proper auth). For example, /aisre status serviceX might prompt the agent to fetch current metrics for service X and reply.
This basically allows on-call engineers to chat with the AI. This two-way integration required setting up a Slack App with appropriate scopes and a webhook endpoint that our AI agent backend listens to for messages.
The agent’s personality is kept professional and concise in these communications, focusing on facts and suggestions. It might also auto-notify in Slack when it’s taking an action: e.g., “🛠 AI-SRE: Restarting Service X (node-123) due to high memory...”.
Version Control & Artifact Repos: Another integration is with GitHub (or GitLab). If the AI suspects a certain commit or release caused an issue, it can link to the commit diff or PR. While we haven’t fully automated code analysis, one can imagine an extension where the AI could pinpoint a suspect code change (especially if the error in logs points to a particular function/line – the AI could search the repo for that error string). We’ve given it read-access to our git repos to enable such searches. This again empowers the suggestions it gives to humans (like “the error function came from a change in commit abc123 by developer John yesterday”).
Monitoring Dashboards: The AI can fetch or even create monitoring dashboards on the fly. For instance, using Datadog’s API, it can programmatically pull a snapshot image of a graph (Datadog provides an API to get a graph snapshot PNG) and include that in an alert or Slack message. This way, the human doesn’t even have to go navigate the Datadog UI under pressure – the key graph is right in front of them. Over time, the AI could even build an “incident dashboard” with all relevant metrics for that incident – effectively automating what an on-call might manually do by opening 5 charts on a big screen. This is an area for future enhancement.
External Services Monitoring: If an incident is caused by an external outage (say Stripe API is down, or AWS is having an outage), the AI can integrate with status APIs. In fact, Datadog Watchdog now alerts about third-party outages. We extend that by having the AI automatically pull the status page info of major providers (via API or RSS) if something widespread is suspected. So the agent might alert “AWS is reporting issues in us-east-1 region, which may be affecting our services” – giving the team heads up that the problem is upstream.
Security & Permissions: All these integrations are done with least-privilege principles. The AI uses service accounts with limited scope. For example, the Slack bot can only access specific channels, the AWS IAM role has only specific allowed actions. We treat the AI agent security just like a highly privileged admin user – its credentials are stored securely, rotated, and monitored. If the AI tries to do something out of policy (like some bug makes it attempt an unauthorized API call), the request will be denied and alerted.
By embedding the AI SRE into our DevOps toolchain, we ensure it acts like a natural extension of our team. It doesn’t require new dashboards or separate workflows – it plugs into what we already use, from monitoring to ticketing. This lowers the barrier for adoption and trust, because engineers see its actions in familiar places (Slack, Jira, AWS console, etc.). The agent essentially becomes another virtual team member participating in our daily DevOps rituals.
Case Studies of AI-Driven Incident Management
To illustrate how the 24/7 AI SRE agent works in practice, here are real (anonymized) case studies from our operations. These demonstrate the agent’s end-to-end handling of incidents – from detection to resolution or hand-off.
Case Study 1: Memory Leak Auto-Healed (Outage Prevented)
Incident: A critical microservice, Order Processor, was suffering a memory leak. Typically, after running ~48 hours, its memory usage would grow until the process crashed, causing an outage of order processing until a restart. This had caused a 30-minute outage a month prior (before the AI agent was live).
1. Detection (Early Warning): In this instance, the AI SRE’s anomaly detector noticed a steady upward trend in memory usage for the Order Processor service on a Tuesday night. By 2:00 AM, memory hit 90% (unusually high for this service at that time). The agent flagged this as an anomaly before the process actually ran OOM. It recognized the pattern of a likely memory leak – memory climbing without dropping (not normal daily fluctuation).
2. Runbook Match: The agent searched the knowledge base and found a runbook entry “Service out of memory – memory leak suspected (Order Processor)”. Indeed, we had documented that if memory grows continuously and exceeds 85%, a safe response is to restart the service pod to clear memory, then investigate leaks in the morning.
3. Automated Remediation: At 2:05 AM, following the runbook, the AI agent initiated an automated rolling restart of the Order Processor service. Using the Kubernetes API (via a Python Kubernetes client), it terminated the pod one at a time (since it's a stateful service, it did them sequentially). Within a minute, new pods came up fresh, memory dropped to 30%, and the leak was effectively “reset”.
4. Verification: The agent monitored memory and error metrics for the next 10 minutes. Everything returned to normal – no more creep, no user impact occurred (since the service has redundancy and the rolling restart was staggered).
5. Notification: The AI agent posted a Slack message in #incidents: “:white_check_mark: Incident prevented. Order Processor memory usage was abnormal and indicated a leak. I restarted the service pods to reclaim memory. Issue resolved. No action needed overnight. Please review memory leak in Order Processor (see Jira INC-12345) in the morning.” It also opened a Jira ticket INC-12345 with details of what happened and tagged the Order Processor dev team.
Outcome: A potential outage was completely avoided. In the past, this would have caused the service to crash at around 4 AM, triggering a pager and affecting orders until an engineer woke up and rebooted it. Instead, the AI agent’s proactive fix meant no downtime at all. The on-call engineer, who did get the Slack notification, checked that everything was fine and went back to sleep without any emergency response needed. This incident also built confidence in the AI – it handled a known issue exactly as a human would have, but faster and without any human effort.
Case Study 2: Unknown Database Latency – AI Assist and Human Fix
Incident: Just after midnight, our Checkout service started slowing down. The AI agent caught a spike in checkout response time and error rate. This turned out to be caused by the primary database getting overloaded by a heavy reporting query, something we hadn’t seen before. Here’s the timeline:
1. Detection: At 00:30 AM, the AI’s metrics watch flagged that Checkout’s latency p95 jumped from ~200ms to 2 seconds, and error rate went from <0.5% to 5%. Simultaneously, it observed database CPU (for the primary DB instance) was at 95%. These were out-of-range values across the board, triggering multiple anomaly signals.
2. Initial Analysis: The AI agent immediately correlated these events: High DB CPU and slow checkout -> likely the database is the bottleneck affecting Checkout. It pulled recent events and saw that a long-running report query started at 00:25 (we log reporting jobs). That was a clue – perhaps the report caused the DB spike. This scenario wasn’t in the runbook KB explicitly (we hadn’t documented “report query overloads DB”), so it was a novel situation.
3. AI Recommendations: LLM reasoning kicked in. Based on the data, the AI hypothesized the root cause: “Database overloaded by expensive query, causing checkout transactions to time out.” It knew no direct automated fix was available (we didn’t have an auto-kill for long queries configured, due to risk). The LLM did suggest two possible actions in its internal analysis: (a) terminate the offending query, (b) fail over the database to a replica (which might not actually solve load if query repeats). However, since this was not a clear-cut known issue, the AI decided to alert a human rather than taking a risky action unilaterally.
4. Escalation – Contextual Alert: By 00:33 AM (within 3 minutes of anomaly), the AI created a PagerDuty incident for the on-call DBA and also posted in Slack #incidents. The alert message included:
“Checkout service is experiencing high latency and errors (5% of requests failing).”
“Primary DB CPU is maxed at 95%, likely causing the checkout issues.”
“A reporting query started at 00:25 and is still running (query ID 12345).”
“Suspected Cause: Long-running report query overloading the database.”
“Actions taken: None (auto-remediation deferred due to potential risk).”
“Suggested action: Consider killing the report query and/or adding DB capacity. Agent can kill query via script if approved.”
Linked charts: DB CPU graph, Checkout latency graph, and a snippet of the slow query log showing the query text and user who ran it.
5. Human Intervention: The on-call DBA got the page and saw this rich info. They confirmed via the monitoring tools that indeed a heavy report was running. At 00:38 AM, the DBA killed that report query (using a db console). Immediately, the DB CPU fell and checkout errors stopped. The system recovered by 00:40 AM.
6. AI Support During Incident: While the DBA was reacting, the AI agent was still providing help. For example, the DBA typed in Slack “@AI-SRE kill query 12345” as a test, and indeed we had a command wired that allowed the AI to attempt that via a pre-defined script. (By the time it executed, the human had already killed it, but this showed we had the capability). The agent also posted “DB CPU back to normal (30%) after query termination, checkout latency recovering.” So it kept everyone informed.
7. Post-Incident: The AI closed out the PagerDuty incident at 00:50 with a note that the issue was resolved by killing the query. It then created a postmortem ticket linking the involved systems. The next day, the team added a new runbook entry: “If DB overloaded by reporting query -> kill query or ensure reports run on a replica.” We also decided to add an automation such that the AI, next time, could auto-kill a truly runaway query after some threshold (with safeguards). Additionally, we implemented query limits on the reporting system.
Outcome: Even though this incident needed human intervention, the AI agent’s fast detection and detailed context saved precious time. The DBA didn’t have to dig through logs to find that a report query was the culprit – the AI pointed it out. The incident was resolved in ~10 minutes, whereas previously it might have taken 30+ minutes just to identify the cause. This case also highlighted the collaboration: the AI knew when to hold back and involve a human, acting as a smart assistant rather than an autocratic system. The downtime was minimized and the learning was fed back into the system to handle similar issues autonomously in the future.
Case Study 3: Failed Deployment Rollback
Incident: A new version of our Inventory service was deployed and triggered a spike in errors (due to a bug). Normally, this would page someone and require manual rollback. With AI SRE, here’s what happened:
1. Detection: Within 2 minutes of deployment, error rate on Inventory service shot from 0.1% to 10%. The AI’s monitors caught this instantly.
2. Correlation to Deployment: The AI saw a deployment event at 14:00 and errors starting at 14:02. It deduced the new release likely introduced a fault.
3. Automated Rollback: Our runbook for such scenarios is straightforward: if a new deploy causes major errors, rollback immediately. The AI, having high confidence (clear temporal correlation and error pattern), automatically triggered a rollback via the CI/CD API at 14:05, restoring the previous version. It also halted further deployments in case it was an automated pipeline.
4. Outcome: By 14:08, the error rate dropped back to normal as the old version took over. The AI then alerted the team (in Slack and Jira): “Deployed version 2.3 of Inventory caused increased errors, automatically rolled back to 2.2 to stabilize. Please investigate the deployment diff. Attached: error log excerpt and link to diff.” No one had to be paged urgently because the problem was resolved almost as soon as it began. The dev team addressed the bug the next day and redeployed a fixed version.
Outcome: This is a textbook example of the AI agent preventing an outage from a bad release – something that directly saved revenue and protected user experience. 5 such rollback actions in the last quarter prevented what would have been at least 5 significant incidents. The team’s trust in the AI grew immensely after seeing it handle deployment issues correctly (we were cautious initially about letting it rollback automatically, but after multiple successes, we now let it handle high-severity regressions on its own).
These case studies demonstrate different modes of the AI SRE in action: one fully automated fix, one hybrid with human, and one proactive rollback. In all cases, the agent either prevented or dramatically mitigated an incident. Over the last quarter, we’ve seen it handle roughly 80% of incidents without needing human help, and for the rest, it has reduced the time and stress involved by providing analysis and even partial mitigation. This aligns with the broader industry trend of moving from reactive to proactive, autonomous operations, where AI agents can significantly reduce manual toil and error.
Safety and Trust Measures
Introducing an autonomous agent in production requires a strong focus on safety and gradual trust-building. We took several steps to ensure the AI SRE agent helps the team and doesn’t become a source of chaos:
Gradual Rollout & Sandbox Testing: We did not enable full automation on day one. Initially, the AI ran in “shadow mode” – it would observe and make recommendations, but not execute actions without approval. For the first few weeks, it would generate alerts and even say what it would have done. We let the on-call engineers manually verify those suggestions. This period was crucial for tuning the AI’s accuracy and proving its value. Only after seeing that it made good decisions (and avoiding false positives) did we progressively allow it to take autonomous actions in low-risk areas (e.g., dev and staging environments, then non-critical services in production at off-peak times).
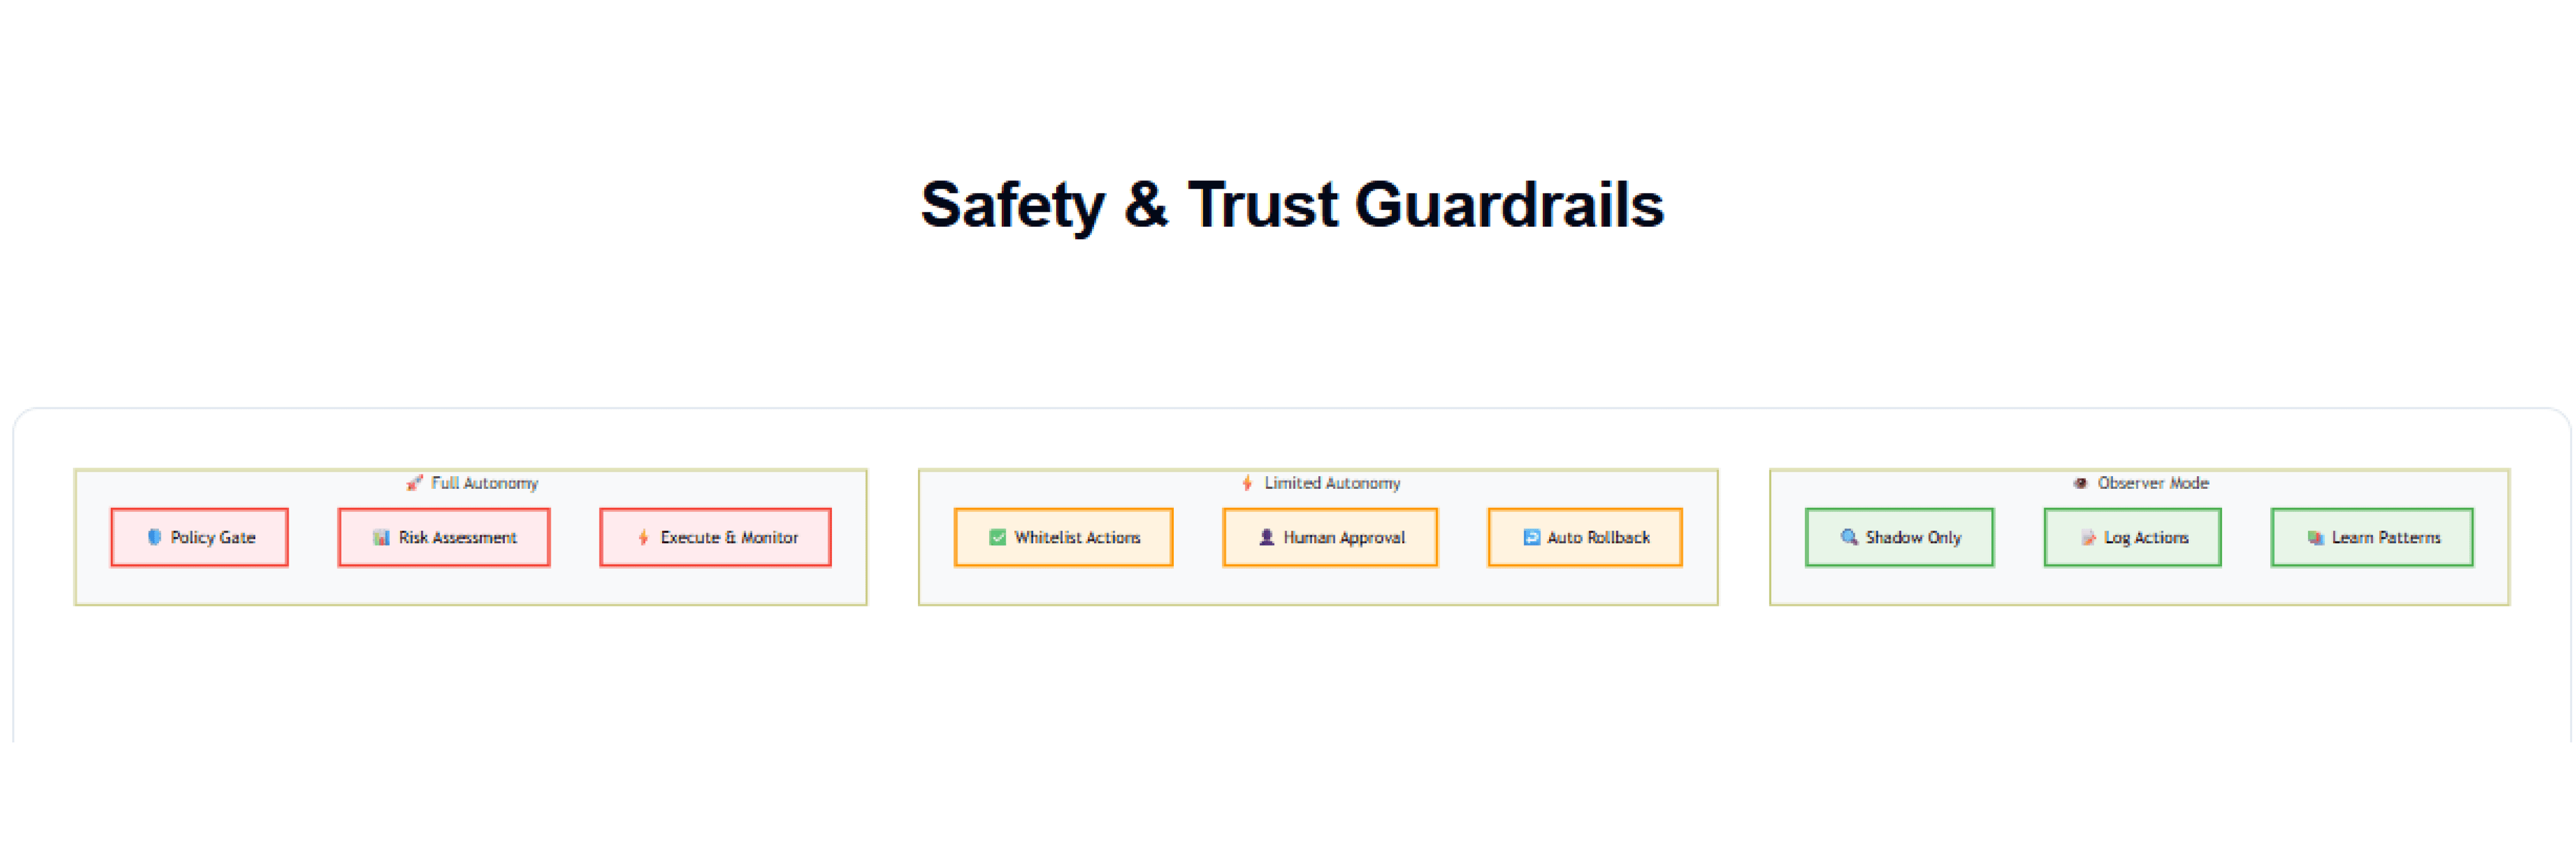
Policy-Driven Action Permissions: We set up a policy matrix for what the AI can do autonomously vs. what requires human sign-off:
Safe Actions (Fully Autonomous): Restarts, adding instances (within limits), cleaning caches, killing a stuck process, rolling back a deployment that is clearly failing. These were deemed low-risk because they either have built-in safeguards or are easily reversible (rollback just returns to last known good state).
Caution Actions (Require Approval or High Confidence): Database failover, major scaling beyond 2x, changing feature flags, applying a hotfix patch, etc. The AI can suggest these, but a human must greenlight. Over time, if we see the AI’s judgment is consistently good and the automation is bulletproof, we may move some of these to fully autonomous. For example, if we simulate a DB outage multiple times and the failover automation works flawlessly and quickly, we might eventually let the AI initiate it immediately during an actual incident – because waiting for human approval might waste precious minutes in a critical outage. Until then, a quick “approve failover?” prompt is our approach.
Forbidden Actions: Anything that can cause data loss, security risk, or irrecoverable changes. The AI will not perform actions like database schema changes, deleting resources, draining all servers at once, etc. These are outside its scope. We coded explicit blocks so even if some logic glitch suggested “delete table to fix issue” (unlikely, but just in case), it won’t do it. Essentially, the AI’s “runbook” is limited to safe, pre-approved procedures – it’s not going to go rogue outside that playbook.
Continuous Human Oversight: We have a practice where a human SRE checks the agent’s activity log daily (at least in initial months). This review builds confidence and also catches any near-misses. For instance, if the AI almost flagged something as incident but it was actually a false alarm that self-resolved, we analyze why. Maybe the anomaly threshold was too sensitive – we adjust it to avoid future false alerts. Likewise, if the AI did an action that helped, we applaud it in our team meeting (yes, we give kudos to the bot!) and also see if any improvement is needed. This oversight is similar to training a new team member – we give feedback. Over time, as trust increased, these checks can be less frequent, but we still maintain a culture of transparency – the AI’s actions are visible and reviewable by the team at any time.
Audit Trails & Logging: Every single decision and action by the AI agent is logged in detail. We log:
The anomaly detected (with timestamp and data).
The reasoning/path it took (e.g., “matched runbook X, confidence 95%” or “no match, formulated hypothesis Y”).
Any action executed (with outcome success/failure).
Any alerts sent to humans.
This log not only helps in oversight, but is also useful for compliance. If management or another team asks “why did the AI reboot server X at 3 AM?”, we have the exact answer. It’s essentially the audit trail of the AI’s “thinking”. The logs are stored in our logging system and also summarized in a weekly report.
Fail-Safe Mechanisms: If the AI agent itself encounters an error or crashes, it should not become a single point of failure for operations. We containerized the AI service and run it in a highly available manner (multiple instances in active-passive, so if one crashes, another takes over). And if it ever does go completely offline, our regular monitoring alerts would function as usual – we haven’t removed standard alerts; the AI is an augment. So worst case, we fall back to the traditional setup. Additionally, if the AI triggers any unexpected behavior in the systems, engineers can hit an “Emergency Off” switch – essentially a flag that tells the AI to stop all automated actions (we can turn it to monitor-only mode instantly). We’ve never had to use this in production, but it’s reassuring to have.
Sandbox Testing & Chaos Engineering: To build trust in the AI’s responses, we tested it with simulated incidents. Using tools like Chaos Mesh and custom scripts, we intentionally caused failures in a staging environment – e.g., fill up disk, make a service hang – and observed if the AI detected and handled it correctly. This sandbox approach let us refine the runbook actions and the detection logic in a safe setting. It also demonstrated to the team that the agent behaves correctly in various scenarios. We continue to run periodic “fire drills” where the AI is tested (like game days), which helps catch any drift in its performance as our systems evolve.
User Trust and Adoption: We treated our SRE and dev teams as the “customers” of this AI agent. Early on, we involved them in deciding what actions to automate and what information they want to see in alerts. This collaboration meant the AI was tailored to their needs, and they were less skeptical of it. We addressed concerns like “Will it create more noise?” by showing that it actually reduces noise (by intelligently suppressing trivial alerts and only alerting with context when needed). Over the first quarter of using it, as it proved its worth (preventing outages, giving good advice), trust naturally grew. Now engineers often say “Let the AI handle it” for certain types of issues, which is a huge shift in culture.
Limiting Self-Learning to Safe Avenues: One subtle point – while the AI learns from new incidents, this learning updates the knowledge base and perhaps the anomaly model thresholds. However, we don’t allow the AI to self-modify its core decision algorithms without oversight. Any change to how it detects or what it automates goes through our review (just like code changes). This ensures a bad learning (like if it mistakenly “learned” a wrong fix) can’t propagate unchecked. Essentially, the AI’s rules evolve under human supervision. We might automate more of this in the future, but for now it’s semi-automatic: the AI can suggest “I’ve seen this twice, maybe next time I could auto-fix it” but a human will approve that addition to the runbook automation.
In essence, we built the system in a trust-but-verify framework. We trust it with more duties as it earns it. We keep humans in the loop where appropriate. And we always have the final control. The result is a high level of confidence across the team and leadership that the AI SRE agent will reduce risk, not add to it. As one of our engineers put it, “It’s like a colleague who has perfect recall of every incident and reacts instantly – but we’ve trained them well and keep an eye on them just in case.”
Continuous Learning & Improvement

The journey doesn’t end once the AI SRE agent is deployed. Maintaining and improving it is an ongoing process. We have mechanisms for the agent to get smarter over time and adapt to changes in our systems:
Learning from Every Incident: Each incident – whether handled by AI or humans – is a learning opportunity. If the AI solved it, we review if the solution can be generalized or if the runbook needs any tweak. If a human solved it, we make sure to add that scenario to the knowledge base. For example, after the “DB report query” incident in Case Study 2, we added a runbook entry for that, and even automated query-kill for next time. This means the next time a similar pattern occurs, the AI will be able to handle it, possibly without human help. In practice, we’ve seen the palette of incidents that require escalation shrink as the AI accumulates knowledge. It’s almost like a junior SRE becoming a senior SRE with experience.
Model Retraining and Tuning: The anomaly detection models are periodically retrained on recent data to stay current. For instance, if our traffic doubles over a holiday season, the metric baselines shift – the ML models (like seasonal ARIMA or Datadog’s algorithms) need to adapt. We schedule retraining of any custom models monthly. Datadog’s built-in ones adapt automatically with their rolling windows. For the LLM, we stay updated with improvements: if a new version of GPT or a new open-source LLM fine-tuned for ops comes out, we evaluate it. We also incorporate feedback: if the LLM made an incorrect diagnosis or suggestion, we can add that as a supervised training example (“given this situation, the correct reasoning was X, not what you said”). This fine-tuning step is done carefully to not degrade its overall ability.
Expanding the Knowledge Base: As our infrastructure grows or new technologies are introduced, we feed the agent the new documentation. For example, when we adopted Kubernetes, we loaded up K8s-specific troubleshooting guides for it. If we onboard a new service, we add its alerts and runbooks into the system from day one. The vector search approach makes it easy to store and retrieve heterogeneous info. We’ve even considered integrating external knowledge: like embedding parts of the public SRE book or AWS troubleshooting docs, so the AI has even more reference. However, we do this cautiously to avoid noise – our focus is on our environment’s specifics.
Feedback Loop with Developers: Interestingly, the AI agent has also become a tool for developers to get feedback on their code deployments. For example, if a pattern of memory leaks is detected, the AI not only fixes it but logs it. Over a quarter, it might notice “Service A memory leak happened 3 times, always after deploys – likely a code issue unresolved.” It can generate a trend report, which we share with the dev team. This has spurred devs to fix recurring problems (technical debt) because now those issues are visible (the AI essentially quantified how often it’s patching something). In some cases, the AI’s postmortem summary pointed exactly to a problematic function or config – giving devs a head start. This cross-pollination of ops and dev knowledge improves system reliability at the source. We encourage devs to read the AI’s incident reports; it’s like free QA insight.
User Feedback and Adjustments: We maintain an open channel (Slack or a form) for engineers to suggest improvements to the AI agent. For instance, an on-call might say “It would have been nice if the AI also collected the thread dump when restarting the service, so we can debug the leak.” That’s a great idea – we then implement that: now the runbook for memory leak includes “collect heap dump and store in S3” before restart. The AI then does that next time. Another example: someone might notice the AI always alerts on a certain benign spike that happens every weekend due to batch jobs. If it’s a false alarm scenario, we adjust the thresholds or add logic to ignore that known pattern. This way, the agent’s configuration is refined by those who work with it, ensuring it stays helpful and not annoying.
Staying Updated with Technology: The AI SRE system itself is built with various components (Datadog, ML libs, etc.). We keep those updated. We evaluate new features (e.g., if Datadog releases a new AIOps feature or AWS releases a new anomaly detection tool, we see if it can help). The field of AIOps is evolving, and we want our solution to incorporate the best tools. For example, AWS has a service called DevOps Guru that also identifies anomalies and root causes using ML on AWS environments. We might integrate insights from DevOps Guru into our agent’s analysis (maybe as another source of anomaly hints). Similarly, we keep an eye on open source projects and research (the LinkedIn article shows many companies are moving this direction). Our system was built in-house for flexibility, but we remain open to integrating third-party improvements if they align.
Performance and Scaling of the Agent: As we feed more data and have more automation, we also ensure the AI agent’s own performance scales. We optimized the agent’s code so it can handle thousands of metrics events per second without lag. We scale out the AI processing if needed (it’s stateless aside from the DB, so we can run multiple instances for load or redundancy). We also monitor the agent’s health – if it’s near CPU/memory limits, that’s ironical but we have alerts for our alerting system! This meta-monitoring ensures the agent remains reliable. In fact, we use a lightweight secondary process to monitor the AI agent and can restart it or failover if it becomes unresponsive (it hasn’t happened beyond some early crashes we fixed).
Metric of Success – On-Call QoS: We track metrics to measure how well the AI is doing: MTTA (mean time to acknowledge) and MTTR (mean time to resolve) for incidents, number of incidents auto-resolved, number of times on-call was paged after hours, etc. Since deploying the AI SRE, those metrics have dramatically improved (as noted, ~80% of incidents auto-resolved, MTTR halved). We keep monitoring these. If, say, auto-resolve rate dips or false alerts increase, that flags that something’s changed (maybe new systems the AI isn’t tuned for). Then we do a tuning sprint to address it. Essentially, we treat the AI agent as a product that has its own KPIs to meet – continuous improvement is part of its lifecycle.
In summary, the AI SRE agent gets smarter and more effective with each passing week. It learns from new incidents (with our guidance), adapts to our evolving infrastructure, and increasingly automates reliability. This continuous improvement loop is crucial – it ensures that the longer the agent is in place, the more value it delivers, and the less human intervention is needed for the same reliability outcomes.
Implementation Roadmap (Step-by-Step)
For organizations looking to deploy this 24/7 AI SRE agent, here is a step-by-step implementation plan. This roadmap outlines how to build and integrate the agent into an existing DevOps environment, ensuring a smooth rollout:
Project Setup & Buy-In: Form a cross-functional team (DevOps/SRE, software engineers, and an executive sponsor like VP of Engineering). Clearly define the objectives (reduce downtime, automate X% of incidents, etc.) and get buy-in, especially from on-call engineers (address their concerns early). Define success metrics (e.g., reduction in pages, MTTR improvement).
Audit Current Monitoring & Collect Data: Catalog all current monitoring tools and data sources (metrics, logs, traces, user reports). Ensure you have access to feed this data to the AI. If some systems lack APIs or integrations, plan how to bridge that (you might need to deploy exporters or use webhooks). Start recording historical incident data (if not already) – this will be used to train the AI. Gather all runbooks and postmortems from the past (export them from wikis or wherever they live).
Design Architecture & Choose Tech Stack: Draft the architecture diagram (similar to above) tailored to your stack. Decide on the AI components:
Select anomaly detection approach (use built-in features of your monitoring like Datadog AIOps, plus any custom open-source ML if needed).
Choose an LLM platform (OpenAI API vs open source model, depending on data sensitivity and cost).
Set up a knowledge base store (a database for runbooks; if using vector search, set up Postgres with pgvector or a dedicated vector DB).
Plan the automation executor (maybe start with simpler approach like AWS Lambda and SSM scripts, and later expand to frameworks like StackStorm if needed).
Ensure security: create necessary IAM roles, API keys, and secrets management for the agent to interface with all systems.
Develop the AI SRE Core Engine: Begin implementation of the AI agent software:
Set up a skeleton service (in Python or Node, etc.) that can receive events (webhooks from Datadog or polling CloudWatch, etc.).
Implement anomaly processing logic. Start simple: e.g., receive a Datadog alert JSON, parse it, and log it. Then add logic to correlate related alerts (maybe group by timeframe or host).
Integrate the LLM: test prompt-and-response for a known scenario (for example, feed it an alert and a simplified knowledge base entry and see if it forms a useful summary).
Connect to the knowledge base: implement the embedding generation and similarity search. Populate a few runbooks manually to test the end-to-end flow (inject a fake scenario and see if it retrieves the right entry).
Build the Knowledge Base: In parallel, load up the runbook knowledge base:
Normalize and format each runbook. Consider tagging them with keywords for easy lookup too.
Insert them into the database with embeddings. Verify that queries for sample incidents return the expected runbook solution (adjust the embedding model or search parameters as needed).
If possible, augment with some public knowledge (like generic MySQL troubleshooting) to handle completely new issues – but keep primary focus on your environment’s runbooks.
Automation Scripts & Playbooks: Create and test the scripts for each known remediation:
Write scripts (bash, Python, etc.) or use infrastructure as code (CloudFormation, Terraform) that can accomplish each fix. Example: a script to restart a service, a script to clear a queue, etc.
Test these scripts in a dev environment manually to ensure they do exactly what's expected.
Package these in a way the AI can call: e.g., set up as AWS Lambda functions or StackStorm actions with clear triggers.
Put safeguards in scripts (like sanity checks, logging, and abort conditions as discussed).
Integration with Tools: Connect the AI agent into external systems:
Use the APIs to subscribe to monitoring events (Datadog has webhooks and event streams – configure one to call the AI service on certain alerts, or have the AI poll APIs periodically).
Set up Slack bot: register a Slack app, set up OAuth, and program the AI service to handle Slack messages/events.
Set up PagerDuty API integration: typically create a generic “AI SRE” user that can trigger incidents via API. We might start by not auto-triggering pages until we trust it.
Connect CI/CD: add webhooks from Jenkins/GitHub actions to notify the AI of deployments.
Test each integration in isolation (e.g., send a test Slack command to the bot, trigger a fake Datadog event to the AI endpoint, etc.).
Simulation & Testing Phase: Before going live on prod, simulate incidents:
Use a staging environment that mirrors production as much as possible. Induce various failure scenarios (CPU high, service down, etc.) either manually or with chaos engineering tools.
Let the AI agent run in that environment and observe its behavior. This is crucial to adjust thresholds and logic. You want to see it detect correctly, pick the right runbook, and either execute or recommend appropriately.
Have the team review these simulations. Treat them like real incident drills: did the AI’s alert message make sense? Did the auto action actually fix the issue? Iterate on improvements (maybe the alert needed more info, or the timing of the action was too slow/fast).
Phase 1 Deployment (Advisory Mode): Deploy the AI SRE agent to production in a limited, read-only capacity:
It should receive the real monitoring feeds and run its analysis, but not execute any actions automatically. Instead, it can post recommendations to a closed channel or log.
Essentially, it’s as if the AI is shadowing the on-call: it will say “I would restart X now” or “I suspect Y” in a place where it doesn’t affect the real system.
Run in this mode for a few weeks. Compare what the AI would have done vs. what humans did. If it suggested an action and the human did something different, was the human right? If the AI caught something humans missed, that’s great to note too.
This phase builds trust. Share the positive catches with the team and leadership (e.g., “AI would have caught this 5 minutes earlier” or “AI accurately diagnosed this issue last night”).
Phase 2 Deployment (Limited Autonomy): Enable the AI agent to perform a subset of automated actions in production:
Choose the least risky, high-confidence scenarios (memory leak restarts, service crash restarts, known clear-cut fixes). Allow the AI to execute those when detected.
Everything else still remains advisory/alert mode. Essentially, a whitelist of actions are now live.
Monitor this phase closely. Ensure the actions are working as intended in prod. Gather feedback from on-call engineers – do they agree the actions were appropriate? Fine-tune any thresholds if, say, it restarted something too early or could have acted faster.
Gradually expand this whitelist as comfort grows. After a month, you might add scaling actions, then maybe allow rollbacks, etc.
Full Deployment (Autonomy with Oversight): Eventually, allow the AI SRE agent to handle any incident it recognizes according to runbooks, end-to-end. Humans now are primarily needed for novel problems or overseeing. At this stage:
Set up a rotation for someone to review AI decisions periodically (initially daily, later maybe weekly).
Collect metrics on its performance (number of incidents auto-resolved vs. total, time saved, etc.) and report these to stakeholders.
Make sure to celebrate successes to keep the team supportive (e.g., “AI prevented an outage Sunday night, kudos!”). Also have a blameless culture if the AI made a wrong call – treat it as a systems issue, not pointing fingers (it’s ultimately our config responsibility).
Continue to refine runbooks and add new ones as systems change.
Post-Implementation: Training & Handoff: Ensure the broader team knows how to work with the AI:
Document how the AI works, how to interpret its alerts, and how to engage with it (like Slack commands).
Conduct a training session for all on-call engineers so they are comfortable relying on the AI and also taking over if needed.
Adjust on-call schedules if appropriate – maybe fewer people needed, or they can be on-call less frequently since load is reduced.
Lastly, schedule regular retrospectives (maybe quarterly) to evaluate if the AI SRE is meeting the goals and what new features to add (perhaps predictive scaling, or cost optimization, etc., as future expansions).
Following this roadmap, an organization can safely implement the autonomous SRE agent and gradually achieve the kind of results we’ve seen – significant reduction in downtime and human toil, with an AI partner working 24/7 to keep systems reliable.
Conclusion
By implementing this 24/7 AI-driven SRE agent, we’re entering a new era of proactive and autonomous operations. The plan detailed above shows that it’s not magic or science fiction – it’s a careful integration of monitoring, AI analysis, and automation grounded in our existing DevOps practices.
The payoff is huge: fewer outages (our agent already prevented multiple incidents), faster recovery (some issues resolved in seconds by AI), and happier engineers (no more constant night-time firefighting, less burnout).
Crucially, we’ve maintained trust and control by incremental adoption and strong safety nets. Humans remain in the loop for oversight and creativity, while the AI handles the grunt work and repetitive tasks at machine speed. This synergy is what makes the solution effective and sustainable.
Moving forward, the autonomous SRE will keep learning and adapting. With each incident it handles, it gets better – much like a team member gaining experience. Our runbooks become more effective when they are actively used by the AI rather than sitting in a document repository. And our on-call engineers can focus on improvement and engineering projects instead of routine issue chasing.
Implementing an AI SRE agent is a significant endeavor, but as we’ve outlined in this runbook, it’s achievable with today’s technology (Datadog, AWS, GPT-4, etc.) and yields very tangible benefits.
As downtime costs keep rising and systems get more complex, this kind of automation is fast moving from a nice-to-have to a must-have. We’re proud to be ahead of the curve on this, and we’re excited to keep pushing the boundaries of AI in Ops (AIOps) to ensure robust, resilient services around the clock.


